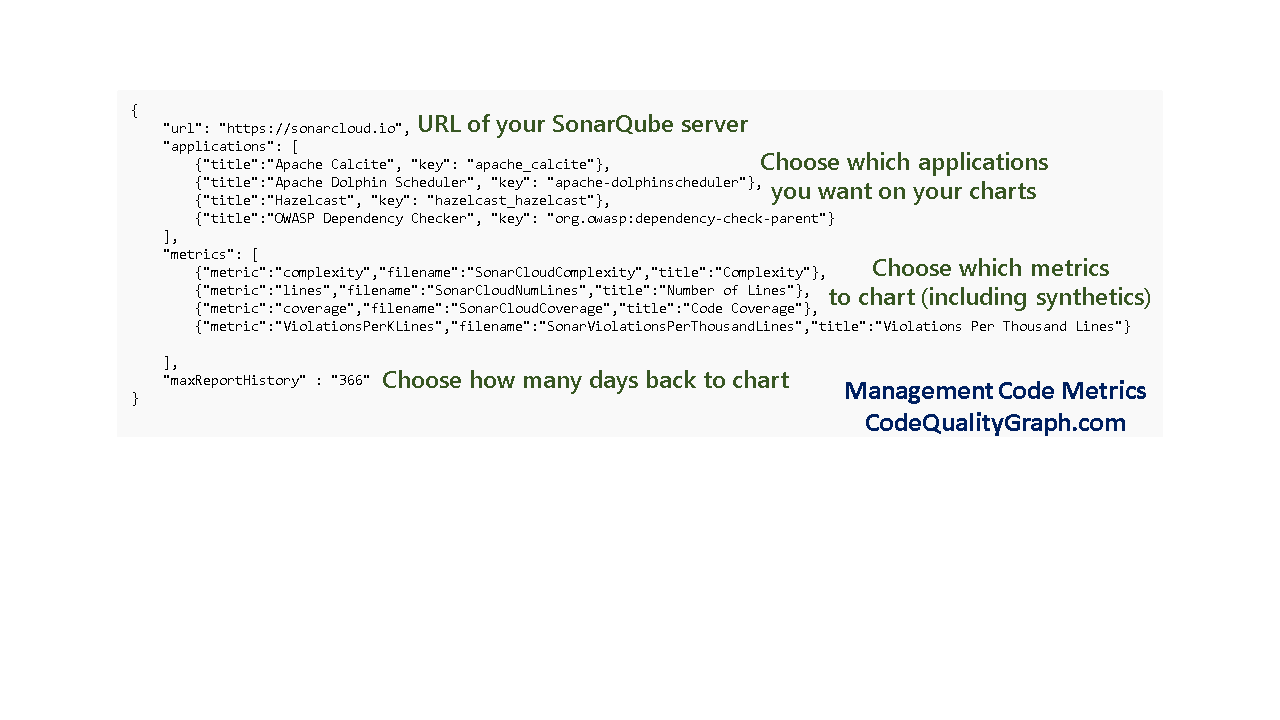
What settings can I tweak in the JSON file?

The "url" should be set to the base URL of your SonarQube instance or from SonarCloud.
The "applications" array lists the different applications to graph. Each item in the array is an object with a "title" and a "key" field. The title is the name of the application you want displayed on the graph, and the key is the project key for the application in SonarQube.
The "metrics" array lists the different PNG files to create and the metric to show on each PNG file. Each item in the array is an object with a "metric", "filename", and "title" field. The metric field is the SonarQube metric name or synthetic metric to graph, the filename specifies the output PNG file for that metric, and the title is displayed on the top of the graph.
As of version 2, the optional "pdf" string is the location to write the PDF file that contains all the PNG files created by the application.
Finally, there is a "maxReportHistory" key, which specifies the number of days the graph will show.

