
Version 3.0.0 released!
Yay! We are proud to release version 3.0.0 of Management Code Metrics, which has the following improvements:
A dashboard! We now create a dashboard of the current state of all your applications in one PDF - and this image starts off your PDF file.
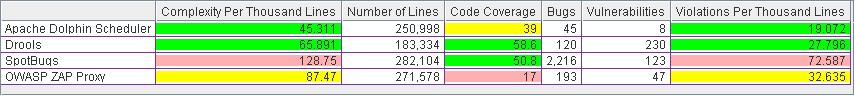
In that dashboard, the we've added the ability to color code your data if you want to give a visual indicator of "good" vs "not so good" vs "we should probably improve this".
For example:
{"metric":"coverage","filename":"CodeCoverage.png","title":"Code Coverage","green":"50","yellow":"1"},
Will show 50%+ Code Coverage as green, 1% to 50% as yellow, 0% as red.
{"metric":"bugs","title":"Bugs","green":"1","yellow":"100"},
Will show 1 bug or less as green, 100 bugs down to 2 bugs as yellow, and 101+ bugs as red.
If you decide you wont want color coding of that column, simply exclude the green and yellow fields and that field will not be color coded.
As always, please feel free to ask a question or open an issue in the github repo at https://github.com/larrydiamond/sqgraph